View the Report
Jump to All Downloads & LinksCHCF offers a snapshot of the health insurance market in California, where 93% of people are enrolled in private or public coverage, with only 7% of the population remaining uninsured. The infographics provide a breakdown of current enrollment in commercial plans and public programs, as well as a visual guide to the consolidation of health insurers since 1985. The timeline marks key milestones in the history of health insurance in California, from the opening of the first prepaid group practice of physicians in Los Angeles, to the historic passage of national health reform in 2010 and beyond.
Largest Sources of Health Insurer Enrollment, Commercial and Public, 2017
These interactive charts illustrate the largest sources of private and public health coverage. Additional detail is provided in the interactive tree diagram, with each insurer’s enrollment shown for the individual, group, self-insured, Medi-Cal, and Medicare markets. Scroll over the segments for more details on each insurer.1
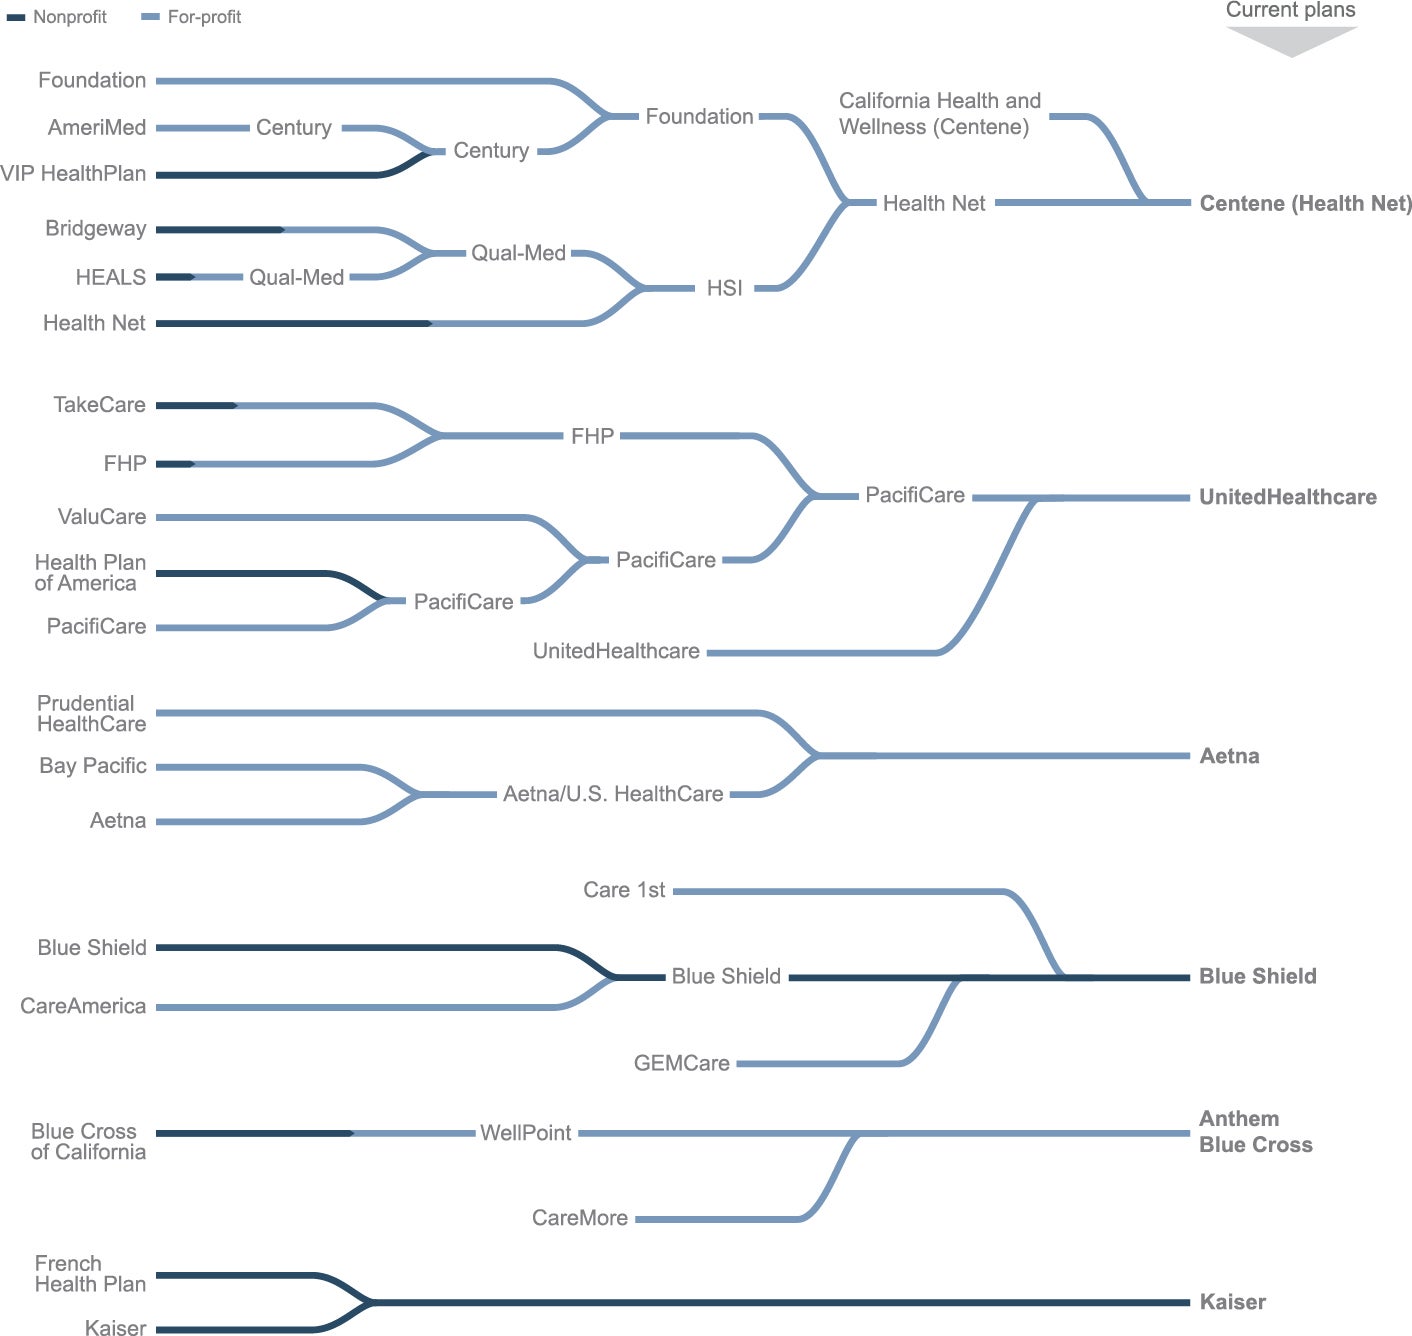
Consolidation of Health Insurers, 1985 to 2018
This chart offers a visual representation of how the key private players in the health insurance market have changed over time and illustrates how for-profit plans — with two major exceptions — are now the most common form of private insurer today.2

Also, a timeline of milestones shows the evolution of the market from 1929 to 2018.
Sources: Health Insurance Enrollment Database, CHCF; HMO/Health Plan’s Financial Statements, DMHC; Insurers Annual Financial Statements, CDI; Membership Directories and Annual Reports, 2002–17, California Association of Health Plans; Katherine Wilson, Health Insurance in California: A Recent History, CHCF; Debra Roth and Deborah Reidy Kelch, Making Sense of Managed Care Regulations in California, CHCF; and Edward R Berchick, Emily Hood, and Jessica C. Barnett, “Table 6” and “Table A-5,” in Health Insurance Coverage in the United States: 2017, Current Population Reports, US Census Bureau, September 2018.
The infographics, which are set up for 11″×17″ paper, are available for download below. These materials are part of CHCF’s California Health Care Almanac, an online clearinghouse for key data and analyses describing the state’s health care landscape.
Authors & Contributors

Katherine Wilson
Katherine Wilson is an independent consultant specializing in health insurance markets and health care costs. She is the author of numerous publications and reports, including CHCF’s series of reports on California health insurers.
- Figures exclude enrollment contracted from other plans. The sum of coverages and the uninsured exceeds California’s population, largely due to double-counting of over a million dually eligible enrollees in the fee-for-service Medicare and Medi-Cal populations. The uninsured estimate relies on self-reported insurance status. As such, it may include undocumented adults who have used restricted scope Medi-Cal, which is limited to emergency and pregnancy-related services, who report their coverage as Medi-Cal. Were these respondents considered uninsured, the number of uninsured Californians would be higher. ↩︎
- Though not exhaustive, the merger schematic depicts significant California consolidation activity related to today’s surviving insurers. Among the plans not shown are Maxicare, Lifeguard, and Health Plan of the Redwoods, all of which were import players at one time but were ultimately dissolved. ↩︎


